[석사학위논문] Jong-Hoon Jeong et al., 2018, Near-Infrared Color-Metallicity Relation for Globular ClusterSystem in Elliptical Galaxy NGC 4649
by 펄서까투리2023. 8. 30.
# 세줄 요약 #
Use Optical and NIR photometry of M60 GC system to examine the GC color distribution morphologies.
Through Optical color & Opt-NIR color relation, we try to deduce the exact shape of CMR, then We use YEPS model to derive the metallicity distribution function (MDF) & color-metallicity relation (CMR) of NGC 4649 GC (* Why NIR Observation? ⇒ directly measures the metallicity of GCs).
Our results support the recent claim that the optical color bimodality observed in early-type galaxies is caused by the nonlinear nature of their color–metallicity relations.
# 상세 리뷰 #
1. Introduction: Color Bimodality
Color distributions of globular clusters (GCs) in most massive galaxies are bimodal.
Two different views!: 1) Two GC subpopulations [*Brodie & Strader 2006], 2) Non-linear color-metallicity relation (CMR) [*Yoon, Yi & Lee 2006]
This debate has lasted for over a decade, with more than 300 SCI papers with color bimodality as keywords.
Figure – (Left) The color distribution in V-I of globular clusters (GCs) of the large elliptical galaxy M87 in
the Virgo cluster. We can see that the color distribution of GCs is bimodal. (Right) Two different views on
color bimodality. If the CMR is straight, color bimodality is translated into metallicity bimodality. However,
if CMR is nonlinear, even from a bimodal metallicity distribution, one can obtain bimodal color
distribution due to projection effect.
2. Observational Data
Target: Elliptical Galaxy M60 (NGC4649): The third-brightest giant elliptical galaxy of the Virgo cluster of galaxies [*Distance = 16.8 ± 1.2 Mpc (Mey et al. 2007) / *Morphological type = E2]
Observation Information
Instrument: Subaru/MOIRCS
Observation date: 2008-04-22
Wavelength: Ks-band (NIR)
Data Reduction: MCSRED (IRAF package)
Ellipse fitting: ELLIPSE & BMODEL (IRAF)
Photometry: IRAF/DAOPHOT
Matching with optical band data
HST/ACS (Strader et al. 2012) : g, z band data / GC candidates number = 1603
Gemini/GMOS (Faifer et al. 2012) : g, r, i band data / GC candidates number = 1546
The GCs matched with all optical band catalog: g, r, i, z, Ks band data / GC candidates number = 769
Figure – (Top) Stacked Subaru / MOIRCS image of NGC 4649. The FOV (field of view) size is 10.2’ X 4.4'. NGC
4647, a neighboring spiral galaxy, is at the bottom; (Bottom) the final image with galaxy background light
removed by ellipse fitting. 749 all matched GC candidates shown by blue circles in image.
3. Results
Color Distribution: In Opt-NIR color, bimodality is weakened! ➜ Nonlinear CMR?
Figure – (Top row) The color-magnitude
distributions (CMDs) in the optical color of
NGC 4649 GCs. We have a total of four
colors g-r, g-i, g-z, r-i. These optical color
CMDs show color bimodality. Especially, g-i
and g-z colors show the strongest color
bimodality. (Bottom row) The CMDs in the
optical-NIR color. In the optical-NIR color, as
well as the optical color, we obtained the
following four colors: g-Ks, r-Ks, i-Ks, z-Ks.
Unlike optical color, bimodality is weakened.Figure - (Top row) Optical color histograms
of NGC 4649 GCs. the g-r, g-i, g-z and r-i
color show a bimodal distribution. In
particular, color distribution of g-i and g-z
colors is most apparently bimodal. (Bottom
row) Color distributions in the Opt-NIR
color. Unlike the optical colors, the Opt-NIR
colors look like a single normal distribution.
From left to right, that is, as the color
approaches the near infrared wavelength
band, the bimodality becomes weaker and
unimodal distribution appears.
Color-color Relations: 1) Colors behave differently as a function of metallicity. 2) The relations between different color indices give Information on the color-metallicity relation
Figure – The 16 Optical color & Opt-NIR color
relation diagram. We have four Optical
colors(g-r, g-i, g-z, r-i) and four Opt-NIR
colors(g-Ks, r-Ks, i-Ks, z-Ks), so we could
combine them to get a total of 16 optical
color & Opt-NIR color plots. Black dots are
picked by error cutting and 3-sigma clipping.
Data points are divided into several
orthogonal bins by linear regression line and
the average value of each is expressed as the
black diamonds. The black solid line
represents a linear fit, and the color-color
relation is non-linear when compared to
binned data points. Green lines and blue lines
are cubic and quartic polynomials,
respectively. In the plot of optical g-z color
(bimodality was strongest) and Opt-NIR z-Ks
color (bimodality was weakest), we can see
that the color-metallicity relation has the
most non-linear feature (See the third plot in
the bottom row).
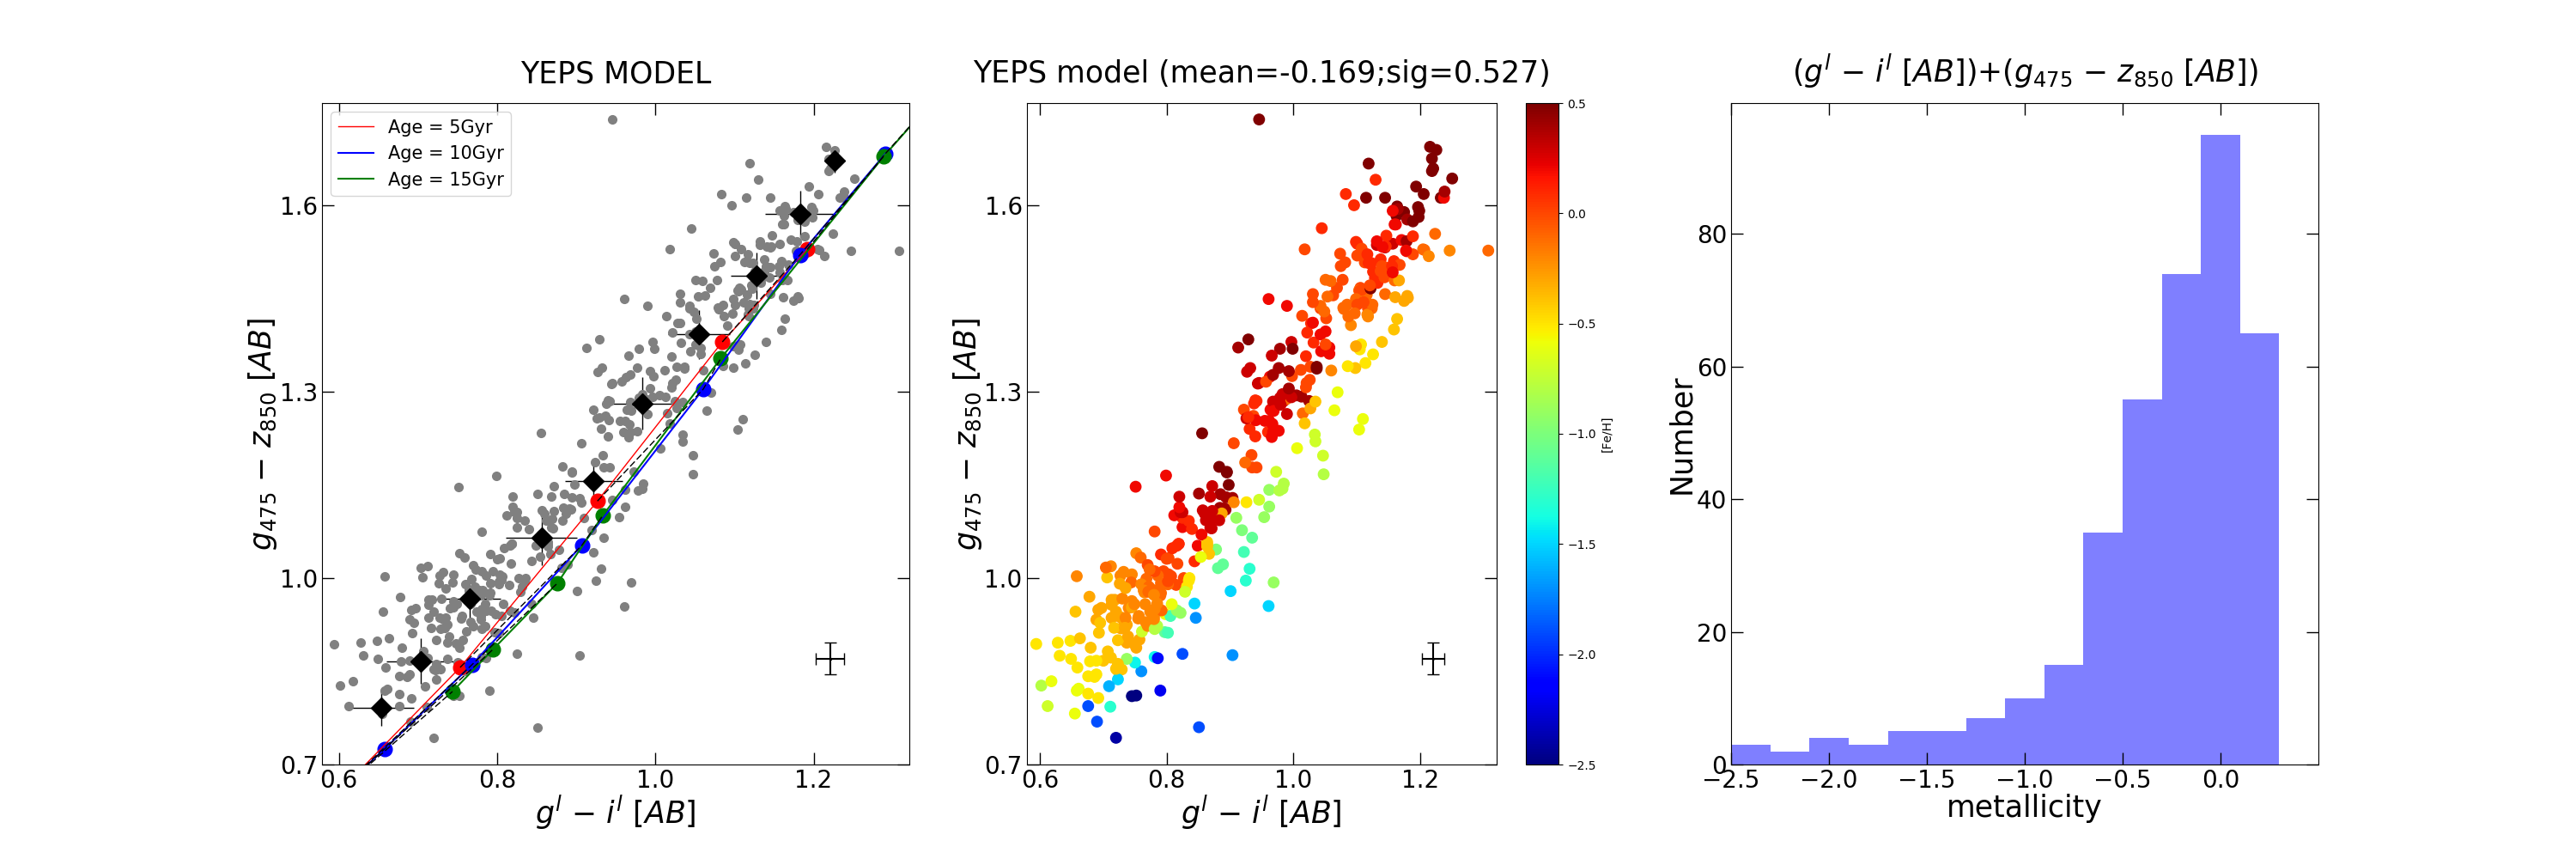
Metallicity Distribution Function: 1) The stellar population model does not fit well in Optical color & opt-NIR color plot. 2) Use YEPS model to derive the metallicity distribution function (MDF) in Optical color-color plot. 3) Then, the obtained metallicity distribution is converted into color by using the YEPS model.
Figure – (Left) optical g-i color & g-z color relation
diagram with YEPS model fitting line. (Middle)
Using the Yeps model fitted on the color-color plot,
the metallicity values of each GCs are obtained by
chi square minimization method. The degree of
metallicity of the GC points are shown in color.
(Right) show the Metallicity distribution function.
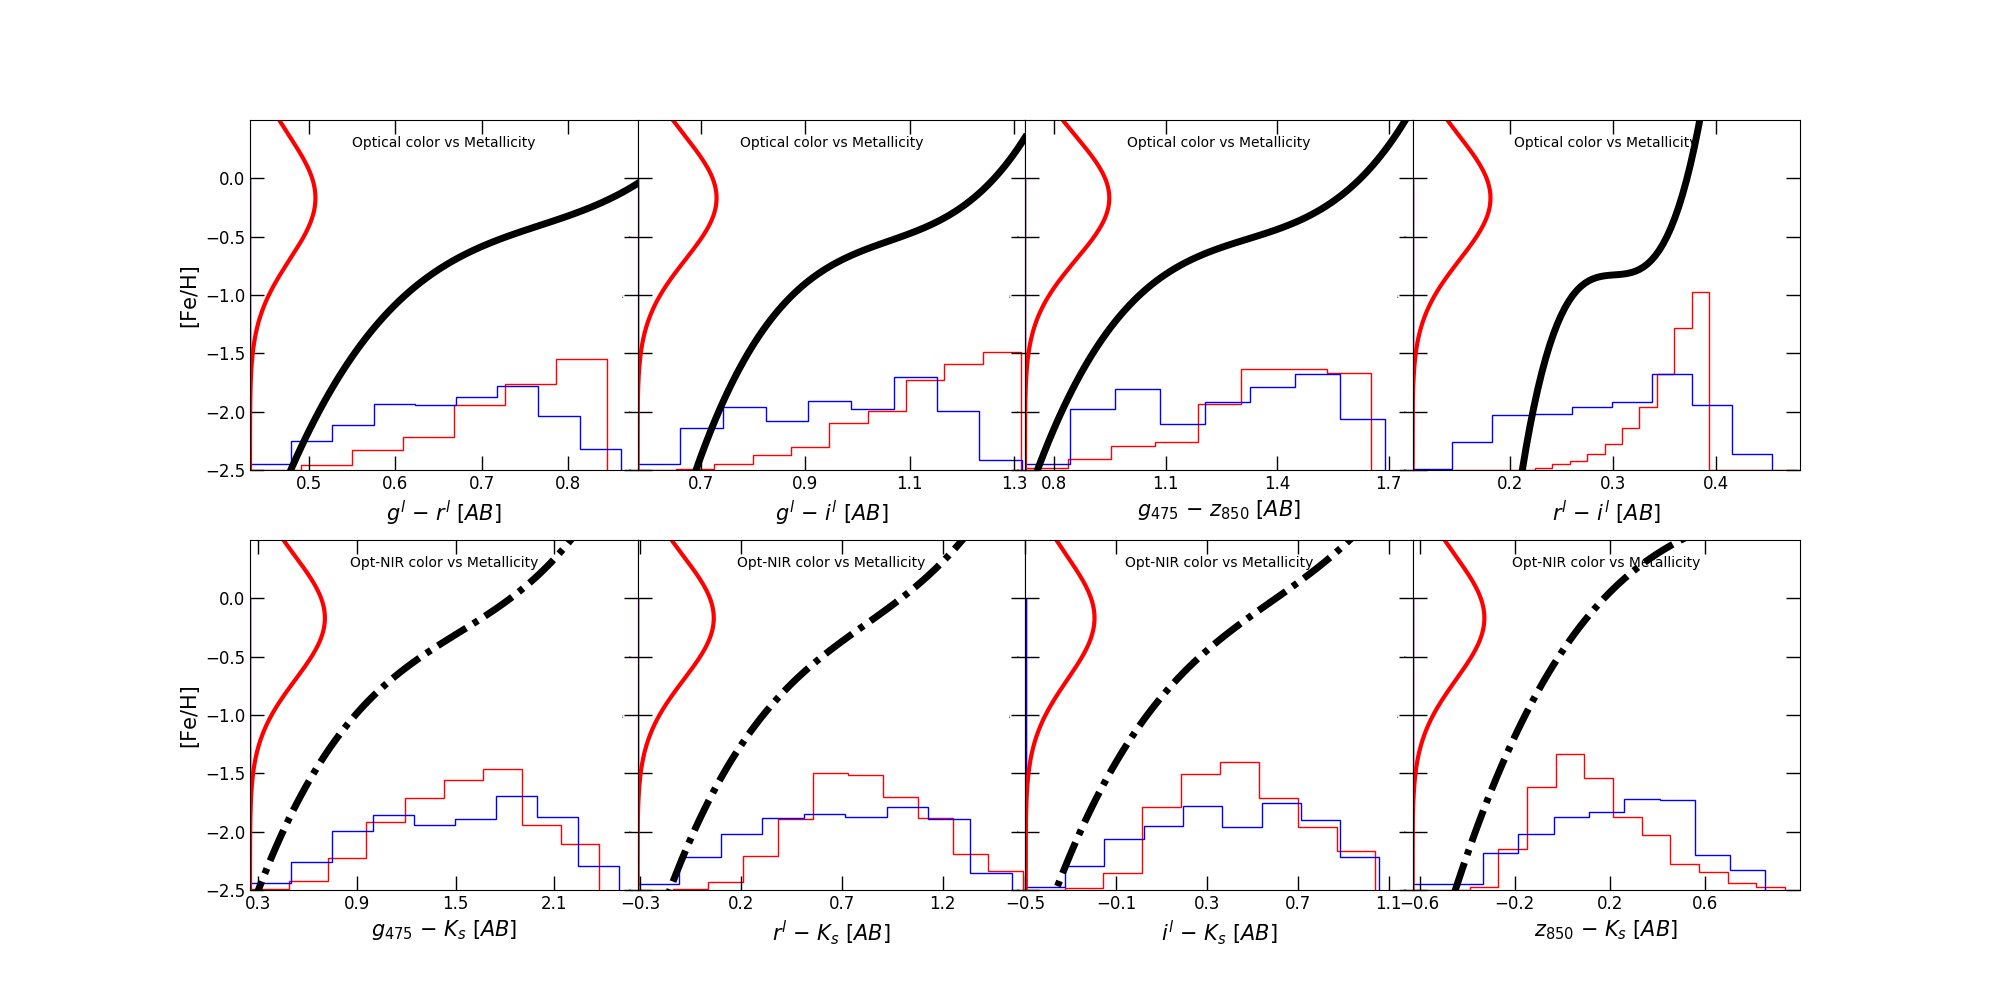
Metallicity range is -2.5 to 0.5 [Fe/H].Figure – (Top row) The color-metallicity relations (CMRs) in the optical colors (g-r, g-i, g-z, r-i) of NGC 4649 GCs. The
black line is the color-metallicity relation line obtained with the YEPS model and the age is assumed to be 13 Gyr.
The red line on the Y axis shows the normal distribution of the MDF obtained by optical color-color plot. The blue
histogram represents the original color distribution, and the red histogram represents the conversion color
distribution obtained by converting 1000 arbitrary metallicity data assuming normal distribution to color using
CMR. (Bottom row) The color-metallicity relations (CMRs) in the Opt-NIR colors (g-Ks, r-Ks, i-Ks, z-Ks) of NGC 4649
GCs. Only the CMR line is drawn as a dot-dashed black line, and the other lines are the same as the top row plots.
# Reference:
[학위논문] 정종훈, NIR Color-Metallicity Relations and Color Distributions of Globular Clusters in Elliptical Galaxy NGC 4649 with Subaru/MOIRCS, 연세대학교, 일반대학원 학위논문, 2018.
[국제학회] Jong-Hoon Jeong, Sooyoung Kim, Suk-Jin Yoon, NIR Color–Metallicity Relations and Color Distributions of Globular Cluster system in Elliptical Galaxy NGC 4649 with Subaru/MOIRCS, IAUGA (General Assembly International Astronomical Union), 2018


댓글