Chies-Santos et al., 2012, An optical/NIR survey of globular clusters in early-type galaxies. III. On the colour bimodality of globular cluster systems
by 펄서까투리2021. 10. 10.
# 세줄 요약 #
We study optical/near-infrared (NIR) colour distributions of the GC systems in 14 E/S0 galaxies.
We find that double-peaked colour distributions are more commonly seen in optical than in optical/NIR colours
A bimodal optical colour distribution is not necessarily an indication of an underlying bimodal metallicity distribution.
# 상세 리뷰 #
1. Introduction
AIM: Study optical/NIR color distribution of GC system in 14 E/S0 galaxies.
with KMM & GMM Test
GC system exhibit a bimodal optical distribution in early-type galaxies
Property GC populations are not too distinct
evidence of non-linear color-metallicity relation?
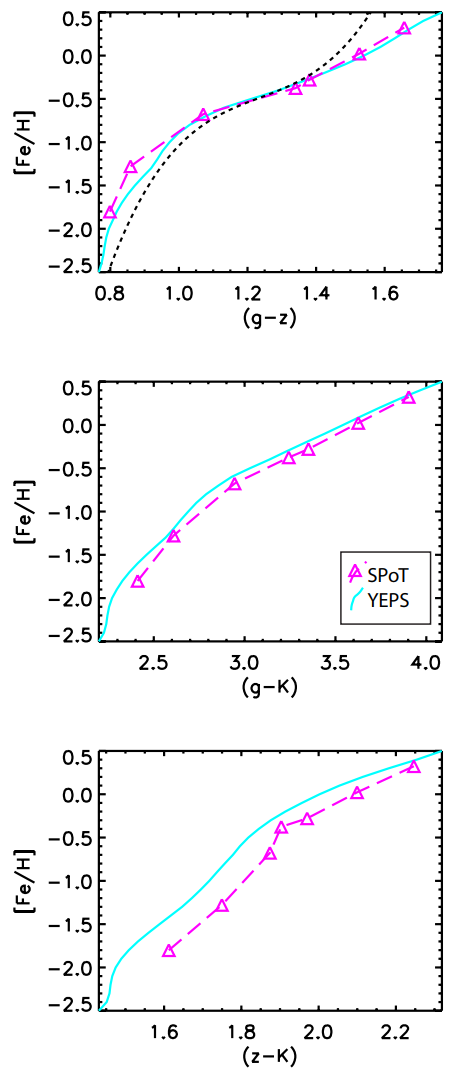
Fig 1. 14 Gyr SPoT and YEPS (g − z), (g − K) and (z − K) colour-metallicity relations. The black short-dashed-line in the first panel corresponds to the empirical relation to the Peng et al. (2006) data for Milky Way and Virgo Cluster GCs (Blakeslee et al. 2010)
2. Discussion
(g-z), (g-k), (z-k) -> GC systems of 14 E/S0 galaxies.
Fig 3. (g − z), (g − K) and (z − K) colour distributions for the different GC systems. Over plotted are the bimodal (blue and red peaks in the corresponding colours) distributions returned by KMM and the sum of the blue and red peaks (in green).
Non-linear feature around (z-k) ~ 2 & (g-k) ~ 3.2
HB stars show similar feature
Fig 2. (z − K) vs. (g − K) for GCs of NGC 4486 and NGC 4649, Note the wavy feature the data presents around (z− K) ∼ 2 and (g− K) ∼ 3.2. Upper panel: a running median on the data points; middle panel: 14 Gyr SpOT-Teramo and YEPS SSPs with a realistic treatment of the HB morphology (Raimondo et al. 2005; Yoon et al. 2006; Yoon et al. 2011a,b); Bottom panel: Maraston (2005) with blue and red HB at the lowest metallicities and Padova08 14 Gyr SSPs.
Optical color (g-z): clear bimodality v.s. Opt/NIR color (z-k, g-k): less bimodality
Fig 5. NGC 4486, NGC 4649, and NGC 4552 colour distributions in (g − z), (g − k) and (z − k). The open histogram are the colour distributions for all clusters that make the final sample. The hashed histograms show the same distributions when only the clusters with Kerr ≤ 0.1 are left in the sample and the filled histogram when only the clusters with Kerr ≤ 0.05 are present.
Exception (g-k) case
NGC 4486: bimodal color distribution -> K-band error effect X
NGC 4649: clear bimodal color distribution.
Fig 6. Illustration for NGC 4486 on how the simulations with realistic photometric errors were performed. Top panels: the (g − K) and (z − K) colour distributions. Middle panels: the data and the modeled photometric scatter (K_err) as a function of K and one outcome of the randomly sampled photometric scatter (K_err_ran ) as a function of K. Bottom panels: the (g − K) and (z − K) simulations with K_err_ran added.
Deep observation & a Large sample of GC systems are needed!
* Reference: Chies-Santos, A. L., “An optical/NIR survey of globular clusters in early-type galaxies. III. On the colour bimodality of globular cluster systems”, [Astronomy and Astrophysics], vol. 539, 2012. doi:10.1051/0004-6361/201117169.


댓글