Cho et al., 2016, The Globular Cluster System of the Coma cD Galaxy NGC 4874 from Hubble Space Telescope ACS and WFC3/IR Imaging
by 펄서까투리2020. 7. 28.
# 세줄요약 #
Coma 은하단의 cD 타입 은하인 NGC 4874의 구상성단계를 연구한 논문으로 가시광선(Optical) 영역에서는 HST/ACS를 사용하여 g, I 파장대에서 관측하였고, 근적외선(Near-IR) 영역에서는 HST/WFC3를 사용하여 H 파장대에서 관측하였다.
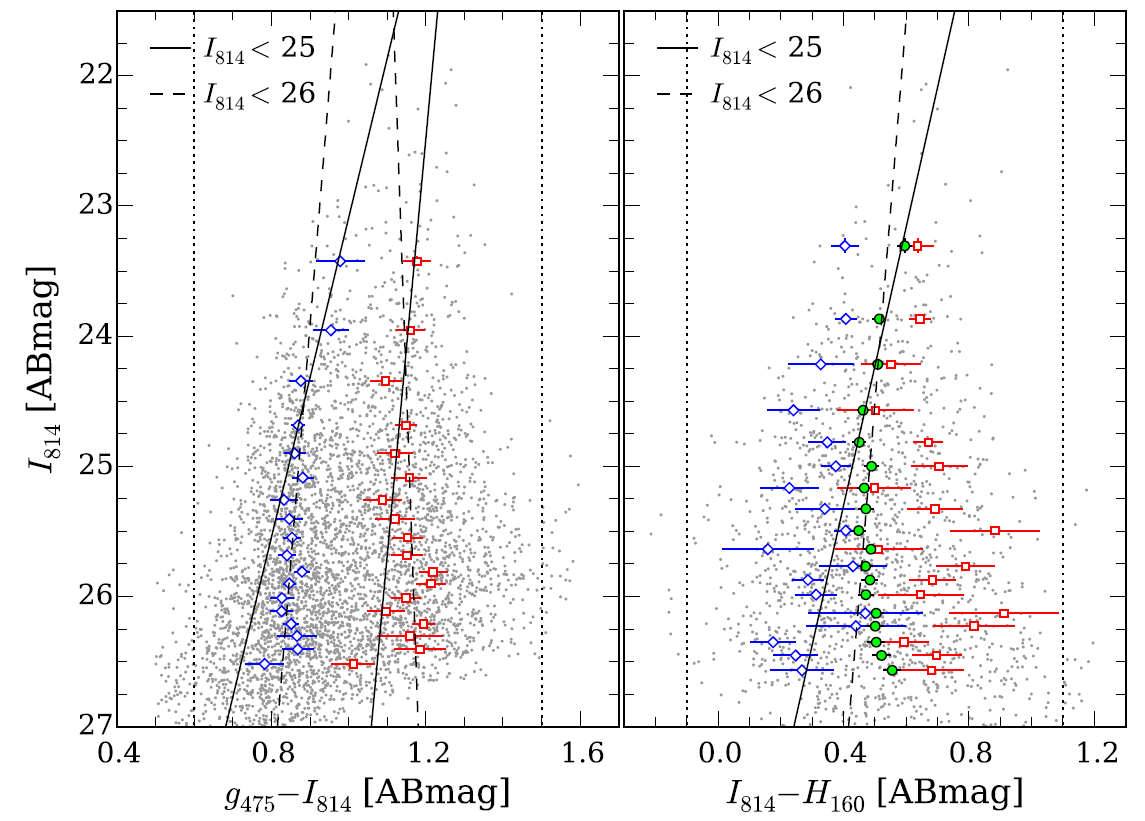
Optical color인 (g-I)에서는 구상성단(GC: Globular Cluster)들의 Bimodality가 나타나나, Optical-NIR color인 (I-H)에서는 GC들의 Bimodality가 약화되는 것으로 보인다.
Metallicity에 더 민감한 Optical-NIR color에서는 Bimodality가 약화된 것으로 보아 Nonlinear Color-Metallicity Relation을 가지는 것으로 유추할 수 있으며, 따라서 타원은하 구상성단계의 중원소 함량 분포에 대한 더 깊은 연구가 필요하다.
# 상세리뷰 #
* Author: Hyejeon Cho, John P. Blakeslee, Ana L. Chies-Santos, M. James Jee, Joseph B. Jensen, Eric W. Peng, and Young-Wook Lee
1. Introduction
Target: GC system of NGC 4874 (cD galaxy in Coma cluster)
Optical passband: HST/ACS = g, I / NIR passband: HST/WFC3 = H
Figure 1. Stacked HST ACS/WFC F814W image of the field roughly centered on NGC 4874. The size of the field is 3'.52×3'.56. (a) The drizzled science image, shown at the observed orientation. (b) The sum of ELLIPSE-generated isophotal models for NGC 4874 and nine surrounding galaxies. (c) The sum of galaxy isophotal models and a large-scale residual map constructed using SExtractor. (d) The final “residual image” used for the object detection with the isophotal models and SExtractor background subtracted.
2. GCs bimodality
Optical g-I color: Bimodality 존재 / Opt-NIR I-H color: 상대적으로 Bimodality 약화
Non-linear color-color relation (g-I vs I-H)
GCs bimodality를 해석하기 위해 color-metallicity relation에 대한 더 깊은 이해가 필요하다.
Blue tilt
Optical color: blue GC들에게서 주로 보이며, self enrichment에 의한 것으로 보임
Opt-NIR color: GC들 전체에서 보이는 평균 경향
Figure 8. I814 vs. g475−I814 color–magnitude diagram (left) and I814 vs. I814−H160 color–magnitude diagram (right). Figure 12. Histograms of g475−I814 and I814−H160 colors for GC candidates within the magnitude range of 23.0<I814<25.0 mag. The black thick solid curve is the nonparametric density estimate constructed with a Gaussian kernel. We also plot the GMM double Gaussian model components for the heteroscedastic case with blue and red solid curves.Figure 14. Optical-NIR I814−H160 vs. purely optical g475−I814 color. The upper panel shows the color–color plane for individual GCs (solid and open gray points) and the modal (most probable) values within twelve bins (dark points with error bars) along with the bisector line (solid black line). The lower panel shows the orthogonal deviations (black squares with error bars) of the twelve binned data points with respect to the best-fit line in the upper panel.
3. GCs Morphology
The blue GCs more extend than the red GCs
Offset of luminosity center v.s. GC system center
Dwarf galaxy: asymmetrical GCs distribution
first infall into coma cluster core
* Reference: Cho, H., Blakeslee, J. P., Chies-Santos, A. L., et al. 2016, ApJ, 822, 95


댓글